| Raw reads | .
|
| Replicate 1 | .
|
| Fastq 1 (7M) | /mnt/scratch/ws/psbelokopytova/202112281307data_Polya/ery_chipseq_CAPH2/raw/NR3/cutadapt_211102_M067_V350034057_L04_NR3_1.fq.gz
|
| Fastq 2 (7M) | /mnt/scratch/ws/psbelokopytova/202112281307data_Polya/ery_chipseq_CAPH2/raw/NR3/cutadapt_211102_M067_V350034057_L04_NR3_2.fq.gz
|
| Trimmed fastq R1 | ./align/rep1/cutadapt_211102_M067_V350034057_L04_NR3_1.trim_50bp.fastq.gz
|
| Replicate 2 | .
|
| Fastq 1 (7M) | /mnt/scratch/ws/psbelokopytova/202112281307data_Polya/ery_chipseq_CAPH2/raw/NR5/cutadapt_211102_M067_V350034057_L04_NR5_1.fq.gz
|
| Fastq 2 (7M) | /mnt/scratch/ws/psbelokopytova/202112281307data_Polya/ery_chipseq_CAPH2/raw/NR5/cutadapt_211102_M067_V350034057_L04_NR5_2.fq.gz
|
| Trimmed fastq R1 | ./align/rep2/cutadapt_211102_M067_V350034057_L04_NR5_1.trim_50bp.fastq.gz
|
| Control 1 | .
|
| Fastq 1 (9M) | /mnt/scratch/ws/psbelokopytova/202112281307data_Polya/ery_chipseq_CAPH2/raw/NR4/cutadapt_211102_M067_V350034057_L04_NR4_1.fq.gz
|
| Fastq 2 (9M) | /mnt/scratch/ws/psbelokopytova/202112281307data_Polya/ery_chipseq_CAPH2/raw/NR4/cutadapt_211102_M067_V350034057_L04_NR4_2.fq.gz
|
| Control 2 | .
|
| Fastq 1 (9M) | /mnt/scratch/ws/psbelokopytova/202112281307data_Polya/ery_chipseq_CAPH2/raw/NR6/cutadapt_211102_M067_V350034057_L04_NR6_1.fq.gz
|
| Fastq 2 (9M) | /mnt/scratch/ws/psbelokopytova/202112281307data_Polya/ery_chipseq_CAPH2/raw/NR6/cutadapt_211102_M067_V350034057_L04_NR6_2.fq.gz
|
| Alignment | .
|
| Replicate 1 | .
|
| Bam (12M) | ./align/rep1/cutadapt_211102_M067_V350034057_L04_NR3_1.PE2SE.bam
|
| Bam R1 | ./align/rep1/cutadapt_211102_M067_V350034057_L04_NR3_1.trim_50bp.bam
|
| Filtered & deduped bam (9M) | ./align/rep1/cutadapt_211102_M067_V350034057_L04_NR3_1.PE2SE.nodup.bam
|
| Tag-align R1 | ./align/rep1/cutadapt_211102_M067_V350034057_L04_NR3_1.trim_50bp.tagAlign.gz
|
| Tag-align | ./align/rep1/cutadapt_211102_M067_V350034057_L04_NR3_1.PE2SE.nodup.tagAlign.gz
|
| Replicate 2 | .
|
| Bam (14M) | ./align/rep2/cutadapt_211102_M067_V350034057_L04_NR5_1.PE2SE.bam
|
| Bam R1 | ./align/rep2/cutadapt_211102_M067_V350034057_L04_NR5_1.trim_50bp.bam
|
| Filtered & deduped bam (10M) | ./align/rep2/cutadapt_211102_M067_V350034057_L04_NR5_1.PE2SE.nodup.bam
|
| Tag-align R1 | ./align/rep2/cutadapt_211102_M067_V350034057_L04_NR5_1.trim_50bp.tagAlign.gz
|
| Tag-align | ./align/rep2/cutadapt_211102_M067_V350034057_L04_NR5_1.PE2SE.nodup.tagAlign.gz
|
| Control 1 | .
|
| Bam (18M) | ./align/ctl1/cutadapt_211102_M067_V350034057_L04_NR4_1.PE2SE.bam
|
| Filtered & deduped bam (12M) | ./align/ctl1/cutadapt_211102_M067_V350034057_L04_NR4_1.PE2SE.nodup.bam
|
| Tag-align | ./align/ctl1/cutadapt_211102_M067_V350034057_L04_NR4_1.PE2SE.nodup.tagAlign.gz
|
| Control 2 | .
|
| Bam (18M) | ./align/ctl2/cutadapt_211102_M067_V350034057_L04_NR6_1.PE2SE.bam
|
| Filtered & deduped bam (12M) | ./align/ctl2/cutadapt_211102_M067_V350034057_L04_NR6_1.PE2SE.nodup.bam
|
| Tag-align | ./align/ctl2/cutadapt_211102_M067_V350034057_L04_NR6_1.PE2SE.nodup.tagAlign.gz
|
| Pooled replicate | .
|
| Tag-align | ./align/pooled_rep/cutadapt_211102_M067_V350034057_L04_NR3_1.PE2SE.nodup_pooled.tagAlign.gz
|
| Pooled control | .
|
| Tag-align | ./align/pooled_ctl/cutadapt_211102_M067_V350034057_L04_NR4_1.PE2SE.nodup_pooled.tagAlign.gz
|
| Pseudo-replicates | .
|
| Replicate 1 | .
|
| Pseudo-replicate 1 | .
|
| Tag-align | ./align/pseudo_reps/rep1/pr1/cutadapt_211102_M067_V350034057_L04_NR3_1.PE2SE.nodup.pr1.tagAlign.gz
|
| Pseudo-replicate 2 | .
|
| Tag-align | ./align/pseudo_reps/rep1/pr2/cutadapt_211102_M067_V350034057_L04_NR3_1.PE2SE.nodup.pr2.tagAlign.gz
|
| Replicate 2 | .
|
| Pseudo-replicate 1 | .
|
| Tag-align | ./align/pseudo_reps/rep2/pr1/cutadapt_211102_M067_V350034057_L04_NR5_1.PE2SE.nodup.pr1.tagAlign.gz
|
| Pseudo-replicate 2 | .
|
| Tag-align | ./align/pseudo_reps/rep2/pr2/cutadapt_211102_M067_V350034057_L04_NR5_1.PE2SE.nodup.pr2.tagAlign.gz
|
| Pooled pseudo-replicates | .
|
| Pooled pseudo-replicate 1 | .
|
| Tag-align | ./align/pooled_pseudo_reps/ppr1/cutadapt_211102_M067_V350034057_L04_NR3_1.PE2SE.nodup.pr1_pooled.tagAlign.gz
|
| Pooled pseudo-replicate 2 | .
|
| Tag-align | ./align/pooled_pseudo_reps/ppr2/cutadapt_211102_M067_V350034057_L04_NR3_1.PE2SE.nodup.pr2_pooled.tagAlign.gz
|
| Signal tracks | .
|
| MACS2 | .
|
| Replicate 1 | .
|
| P-value | ./signal/macs2/rep1/cutadapt_211102_M067_V350034057_L04_NR3_1.PE2SE.nodup.tagAlign_x_cutadapt_211102_M067_V350034057_L04_NR4_1.PE2SE.nodup.tagAlign.pval.signal.bw
|
| Fold enrichment | ./signal/macs2/rep1/cutadapt_211102_M067_V350034057_L04_NR3_1.PE2SE.nodup.tagAlign_x_cutadapt_211102_M067_V350034057_L04_NR4_1.PE2SE.nodup.tagAlign.fc.signal.bw
|
| Replicate 2 | .
|
| P-value | ./signal/macs2/rep2/cutadapt_211102_M067_V350034057_L04_NR5_1.PE2SE.nodup.tagAlign_x_cutadapt_211102_M067_V350034057_L04_NR6_1.PE2SE.nodup.tagAlign.pval.signal.bw
|
| Fold enrichment | ./signal/macs2/rep2/cutadapt_211102_M067_V350034057_L04_NR5_1.PE2SE.nodup.tagAlign_x_cutadapt_211102_M067_V350034057_L04_NR6_1.PE2SE.nodup.tagAlign.fc.signal.bw
|
| Pooled replicate | .
|
| P-value | ./signal/macs2/pooled_rep/cutadapt_211102_M067_V350034057_L04_NR3_1.PE2SE.nodup_pooled.tagAlign_x_cutadapt_211102_M067_V350034057_L04_NR4_1.PE2SE.nodup_pooled.tagAlign.pval.signal.bw
|
| Fold enrichment | ./signal/macs2/pooled_rep/cutadapt_211102_M067_V350034057_L04_NR3_1.PE2SE.nodup_pooled.tagAlign_x_cutadapt_211102_M067_V350034057_L04_NR4_1.PE2SE.nodup_pooled.tagAlign.fc.signal.bw
|
| Peaks | .
|
| SPP | .
|
| Pooled Replicate | .
|
| Region peak | ./peak/spp/pooled_rep/cutadapt_211102_M067_V350034057_L04_NR3_1.PE2SE.nodup_pooled.tagAlign_x_cutadapt_211102_M067_V350034057_L04_NR4_1.PE2SE.nodup_pooled.tagAlign.regionPeak.gz
|
| Replicate 1 | .
|
| Region peak | ./peak/spp/rep1/cutadapt_211102_M067_V350034057_L04_NR3_1.PE2SE.nodup.tagAlign_x_cutadapt_211102_M067_V350034057_L04_NR4_1.PE2SE.nodup.tagAlign.regionPeak.gz
|
| Replicate 2 | .
|
| Region peak | ./peak/spp/rep2/cutadapt_211102_M067_V350034057_L04_NR5_1.PE2SE.nodup.tagAlign_x_cutadapt_211102_M067_V350034057_L04_NR6_1.PE2SE.nodup.tagAlign.regionPeak.gz
|
| Pseudo-replicates | .
|
| Replicate 1 | .
|
| Pseudo-replicate 1 | .
|
| Region peak | ./peak/spp/pseudo_reps/rep1/pr1/cutadapt_211102_M067_V350034057_L04_NR3_1.PE2SE.nodup.pr1.tagAlign_x_cutadapt_211102_M067_V350034057_L04_NR4_1.PE2SE.nodup.tagAlign.regionPeak.gz
|
| Pseudo-replicate 2 | .
|
| Region peak | ./peak/spp/pseudo_reps/rep1/pr2/cutadapt_211102_M067_V350034057_L04_NR3_1.PE2SE.nodup.pr2.tagAlign_x_cutadapt_211102_M067_V350034057_L04_NR4_1.PE2SE.nodup.tagAlign.regionPeak.gz
|
| Replicate 2 | .
|
| Pseudo-replicate 1 | .
|
| Region peak | ./peak/spp/pseudo_reps/rep2/pr1/cutadapt_211102_M067_V350034057_L04_NR5_1.PE2SE.nodup.pr1.tagAlign_x_cutadapt_211102_M067_V350034057_L04_NR6_1.PE2SE.nodup.tagAlign.regionPeak.gz
|
| Pseudo-replicate 2 | .
|
| Region peak | ./peak/spp/pseudo_reps/rep2/pr2/cutadapt_211102_M067_V350034057_L04_NR5_1.PE2SE.nodup.pr2.tagAlign_x_cutadapt_211102_M067_V350034057_L04_NR6_1.PE2SE.nodup.tagAlign.regionPeak.gz
|
| Pooled pseudo-replicates | .
|
| Pooled pseudo-replicate 1 | .
|
| Region peak | ./peak/spp/pooled_pseudo_reps/ppr1/cutadapt_211102_M067_V350034057_L04_NR3_1.PE2SE.nodup.pr1_pooled.tagAlign_x_cutadapt_211102_M067_V350034057_L04_NR4_1.PE2SE.nodup_pooled.tagAlign.regionPeak.gz
|
| Pooled pseudo-replicate 2 | .
|
| Region peak | ./peak/spp/pooled_pseudo_reps/ppr2/cutadapt_211102_M067_V350034057_L04_NR3_1.PE2SE.nodup.pr2_pooled.tagAlign_x_cutadapt_211102_M067_V350034057_L04_NR4_1.PE2SE.nodup_pooled.tagAlign.regionPeak.gz
|
| Naive overlap | .
|
| True replicates | .
|
| Rep. 1 vs. Rep. 2 | .
|
| Overlapping peak | ./peak/spp/overlap/true_reps/rep1-rep2/ery_CAPH2_mouse_rep1-rep2.naive_overlap.filt.regionPeak.gz
|
| Pseudo-replicates | .
|
| Replicate 1 | .
|
| Overlapping peak | ./peak/spp/overlap/pseudo_reps/rep1/ery_CAPH2_mouse_rep1-pr.naive_overlap.filt.regionPeak.gz
|
| Replicate 2 | .
|
| Overlapping peak | ./peak/spp/overlap/pseudo_reps/rep2/ery_CAPH2_mouse_rep2-pr.naive_overlap.filt.regionPeak.gz
|
| Pooled pseudo-replicates | .
|
| Overlapping peak | ./peak/spp/overlap/pooled_pseudo_reps/ery_CAPH2_mouse_ppr.naive_overlap.filt.regionPeak.gz
|
| Optimal set | .
|
| Overlapping peak | ./peak/spp/overlap/optimal_set/ery_CAPH2_mouse_ppr.naive_overlap.filt.regionPeak.gz
|
| Conservative set | .
|
| Overlapping peak | ./peak/spp/overlap/conservative_set/ery_CAPH2_mouse_rep1-rep2.naive_overlap.filt.regionPeak.gz
|
| IDR | .
|
| True replicates | .
|
| Rep. 1 vs. Rep. 2 | .
|
| IDR peak | ./peak/spp/idr/true_reps/rep1-rep2/ery_CAPH2_mouse_rep1-rep2.IDR0.05.filt.narrowPeak.gz
|
| Pseudo-replicates | .
|
| Replicate 1 | .
|
| IDR peak | ./peak/spp/idr/pseudo_reps/rep1/ery_CAPH2_mouse_rep1-pr.IDR0.05.filt.narrowPeak.gz
|
| Replicate 2 | .
|
| IDR peak | ./peak/spp/idr/pseudo_reps/rep2/ery_CAPH2_mouse_rep2-pr.IDR0.05.filt.narrowPeak.gz
|
| Pooled pseudo-replicates | .
|
| IDR peak | ./peak/spp/idr/pooled_pseudo_reps/ery_CAPH2_mouse_ppr.IDR0.05.filt.narrowPeak.gz
|
| Optimal set | .
|
| IDR peak | ./peak/spp/idr/optimal_set/ery_CAPH2_mouse_rep1-rep2.IDR0.05.filt.narrowPeak.gz
|
| Conservative set | .
|
| IDR peak | ./peak/spp/idr/conservative_set/ery_CAPH2_mouse_rep1-rep2.IDR0.05.filt.narrowPeak.gz
|
| MACS2 | .
|
| Replicate 1 | .
|
| Narrow peak | ./peak/macs2/rep1/cutadapt_211102_M067_V350034057_L04_NR3_1.PE2SE.nodup.tagAlign_x_cutadapt_211102_M067_V350034057_L04_NR4_1.PE2SE.nodup.tagAlign.pval0.01.500K.narrowPeak.gz
|
| Replicate 2 | .
|
| Narrow peak | ./peak/macs2/rep2/cutadapt_211102_M067_V350034057_L04_NR5_1.PE2SE.nodup.tagAlign_x_cutadapt_211102_M067_V350034057_L04_NR6_1.PE2SE.nodup.tagAlign.pval0.01.500K.narrowPeak.gz
|
| Pooled replicate | .
|
| Narrow peak | ./peak/macs2/pooled_rep/cutadapt_211102_M067_V350034057_L04_NR3_1.PE2SE.nodup_pooled.tagAlign_x_cutadapt_211102_M067_V350034057_L04_NR4_1.PE2SE.nodup_pooled.tagAlign.pval0.01.500K.narrowPeak.gz
|
| Pseudo-replicates | .
|
| Replicate 1 | .
|
| Pseudo-replicate 1 | .
|
| Narrow peak | ./peak/macs2/pseudo_reps/rep1/pr1/cutadapt_211102_M067_V350034057_L04_NR3_1.PE2SE.nodup.pr1.tagAlign_x_cutadapt_211102_M067_V350034057_L04_NR4_1.PE2SE.nodup.tagAlign.pval0.01.500K.narrowPeak.gz
|
| Pseudo-replicate 2 | .
|
| Narrow peak | ./peak/macs2/pseudo_reps/rep1/pr2/cutadapt_211102_M067_V350034057_L04_NR3_1.PE2SE.nodup.pr2.tagAlign_x_cutadapt_211102_M067_V350034057_L04_NR4_1.PE2SE.nodup.tagAlign.pval0.01.500K.narrowPeak.gz
|
| Replicate 2 | .
|
| Pseudo-replicate 1 | .
|
| Narrow peak | ./peak/macs2/pseudo_reps/rep2/pr1/cutadapt_211102_M067_V350034057_L04_NR5_1.PE2SE.nodup.pr1.tagAlign_x_cutadapt_211102_M067_V350034057_L04_NR6_1.PE2SE.nodup.tagAlign.pval0.01.500K.narrowPeak.gz
|
| Pseudo-replicate 2 | .
|
| Narrow peak | ./peak/macs2/pseudo_reps/rep2/pr2/cutadapt_211102_M067_V350034057_L04_NR5_1.PE2SE.nodup.pr2.tagAlign_x_cutadapt_211102_M067_V350034057_L04_NR6_1.PE2SE.nodup.tagAlign.pval0.01.500K.narrowPeak.gz
|
| Pooled pseudo-replicate | .
|
| Pooled pseudo-replicate 1 | .
|
| Narrow peak | ./peak/macs2/pooled_pseudo_reps/ppr1/cutadapt_211102_M067_V350034057_L04_NR3_1.PE2SE.nodup.pr1_pooled.tagAlign_x_cutadapt_211102_M067_V350034057_L04_NR4_1.PE2SE.nodup_pooled.tagAlign.pval0.01.500K.narrowPeak.gz
|
| Pooled pseudo-replicate 2 | .
|
| Narrow peak | ./peak/macs2/pooled_pseudo_reps/ppr2/cutadapt_211102_M067_V350034057_L04_NR3_1.PE2SE.nodup.pr2_pooled.tagAlign_x_cutadapt_211102_M067_V350034057_L04_NR4_1.PE2SE.nodup_pooled.tagAlign.pval0.01.500K.narrowPeak.gz
|
| QC and logs | .
|
| Fingerprint JSD Plot | ./qc/ery_CAPH2_mouse_jsd.png
|
| Replicate 1 | .
|
| Filtered flagstat log | ./qc/rep1/cutadapt_211102_M067_V350034057_L04_NR3_1.PE2SE.nodup.flagstat.qc
|
| JS Distance | ./qc/rep1/cutadapt_211102_M067_V350034057_L04_NR3_1.PE2SE.nodup.jsd.qc
|
| BWA map. flagstat log | ./qc/rep1/cutadapt_211102_M067_V350034057_L04_NR3_1.PE2SE.flagstat.qc
|
| Dedup. log | ./qc/rep1/cutadapt_211102_M067_V350034057_L04_NR3_1.PE2SE.dup.qc
|
| PBC log | ./qc/rep1/cutadapt_211102_M067_V350034057_L04_NR3_1.PE2SE.nodup.pbc.qc
|
| Cross-corr. log | ./qc/rep1/cutadapt_211102_M067_V350034057_L04_NR3_1.trim_50bp.no_chrM.15M.cc.qc
|
| Cross-corr. plot | ./qc/rep1/cutadapt_211102_M067_V350034057_L04_NR3_1.trim_50bp.no_chrM.15M.cc.plot.pdf
|
| Replicate 2 | .
|
| Filtered flagstat log | ./qc/rep2/cutadapt_211102_M067_V350034057_L04_NR5_1.PE2SE.nodup.flagstat.qc
|
| JS Distance | ./qc/rep2/cutadapt_211102_M067_V350034057_L04_NR5_1.PE2SE.nodup.jsd.qc
|
| BWA map. flagstat log | ./qc/rep2/cutadapt_211102_M067_V350034057_L04_NR5_1.PE2SE.flagstat.qc
|
| Dedup. log | ./qc/rep2/cutadapt_211102_M067_V350034057_L04_NR5_1.PE2SE.dup.qc
|
| PBC log | ./qc/rep2/cutadapt_211102_M067_V350034057_L04_NR5_1.PE2SE.nodup.pbc.qc
|
| Cross-corr. log | ./qc/rep2/cutadapt_211102_M067_V350034057_L04_NR5_1.trim_50bp.no_chrM.15M.cc.qc
|
| Cross-corr. plot | ./qc/rep2/cutadapt_211102_M067_V350034057_L04_NR5_1.trim_50bp.no_chrM.15M.cc.plot.pdf
|
| Control 1 | .
|
| Filtered flagstat log | ./qc/ctl1/cutadapt_211102_M067_V350034057_L04_NR4_1.PE2SE.nodup.flagstat.qc
|
| BWA map. flagstat log | ./qc/ctl1/cutadapt_211102_M067_V350034057_L04_NR4_1.PE2SE.flagstat.qc
|
| Dedup. log | ./qc/ctl1/cutadapt_211102_M067_V350034057_L04_NR4_1.PE2SE.dup.qc
|
| PBC log | ./qc/ctl1/cutadapt_211102_M067_V350034057_L04_NR4_1.PE2SE.nodup.pbc.qc
|
| Control 2 | .
|
| Filtered flagstat log | ./qc/ctl2/cutadapt_211102_M067_V350034057_L04_NR6_1.PE2SE.nodup.flagstat.qc
|
| BWA map. flagstat log | ./qc/ctl2/cutadapt_211102_M067_V350034057_L04_NR6_1.PE2SE.flagstat.qc
|
| Dedup. log | ./qc/ctl2/cutadapt_211102_M067_V350034057_L04_NR6_1.PE2SE.dup.qc
|
| PBC log | ./qc/ctl2/cutadapt_211102_M067_V350034057_L04_NR6_1.PE2SE.nodup.pbc.qc
|
| Naive overlap | .
|
| Overlap QC log | ./qc/ery_CAPH2_mouse_peak_overlap_final.qc
|
| True replicates | .
|
| Rep. 1 vs. Rep. 2 | .
|
| FRiP | ./peak/spp/overlap/true_reps/rep1-rep2/ery_CAPH2_mouse_rep1-rep2.naive_overlap.filt.regionPeak.FRiP.qc
|
| Pseudo-replicates | .
|
| Replicate 1 | .
|
| FRiP | ./peak/spp/overlap/pseudo_reps/rep1/ery_CAPH2_mouse_rep1-pr.naive_overlap.filt.regionPeak.FRiP.qc
|
| Replicate 2 | .
|
| FRiP | ./peak/spp/overlap/pseudo_reps/rep2/ery_CAPH2_mouse_rep2-pr.naive_overlap.filt.regionPeak.FRiP.qc
|
| IDR | .
|
| IDR QC log | ./qc/ery_CAPH2_mouse_IDR_final.qc
|
| True replicates | .
|
| Rep. 1 vs. Rep. 2 | .
|
| FRiP | ./peak/spp/idr/true_reps/rep1-rep2/ery_CAPH2_mouse_rep1-rep2.IDR0.05.filt.narrowPeak.FRiP.qc
|
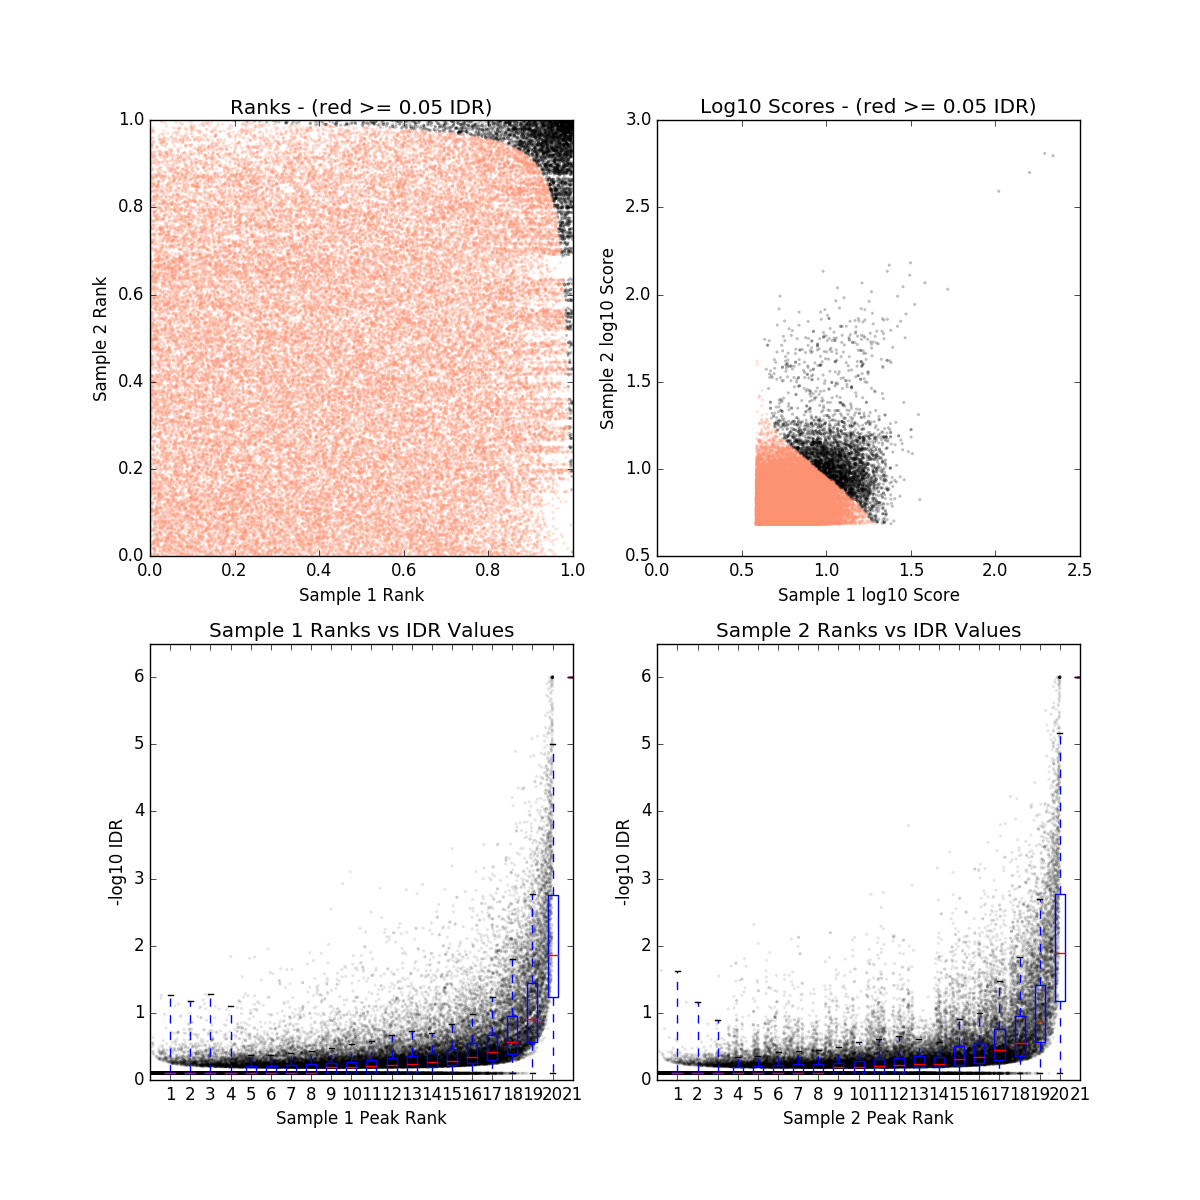
| IDR plot | ./peak/spp/idr/true_reps/rep1-rep2/ery_CAPH2_mouse_rep1-rep2.unthresholded-peaks.txt.png
|
| Pseudo-replicates | .
|
| Replicate 1 | .
|
| FRiP | ./peak/spp/idr/pseudo_reps/rep1/ery_CAPH2_mouse_rep1-pr.IDR0.05.filt.narrowPeak.FRiP.qc
|
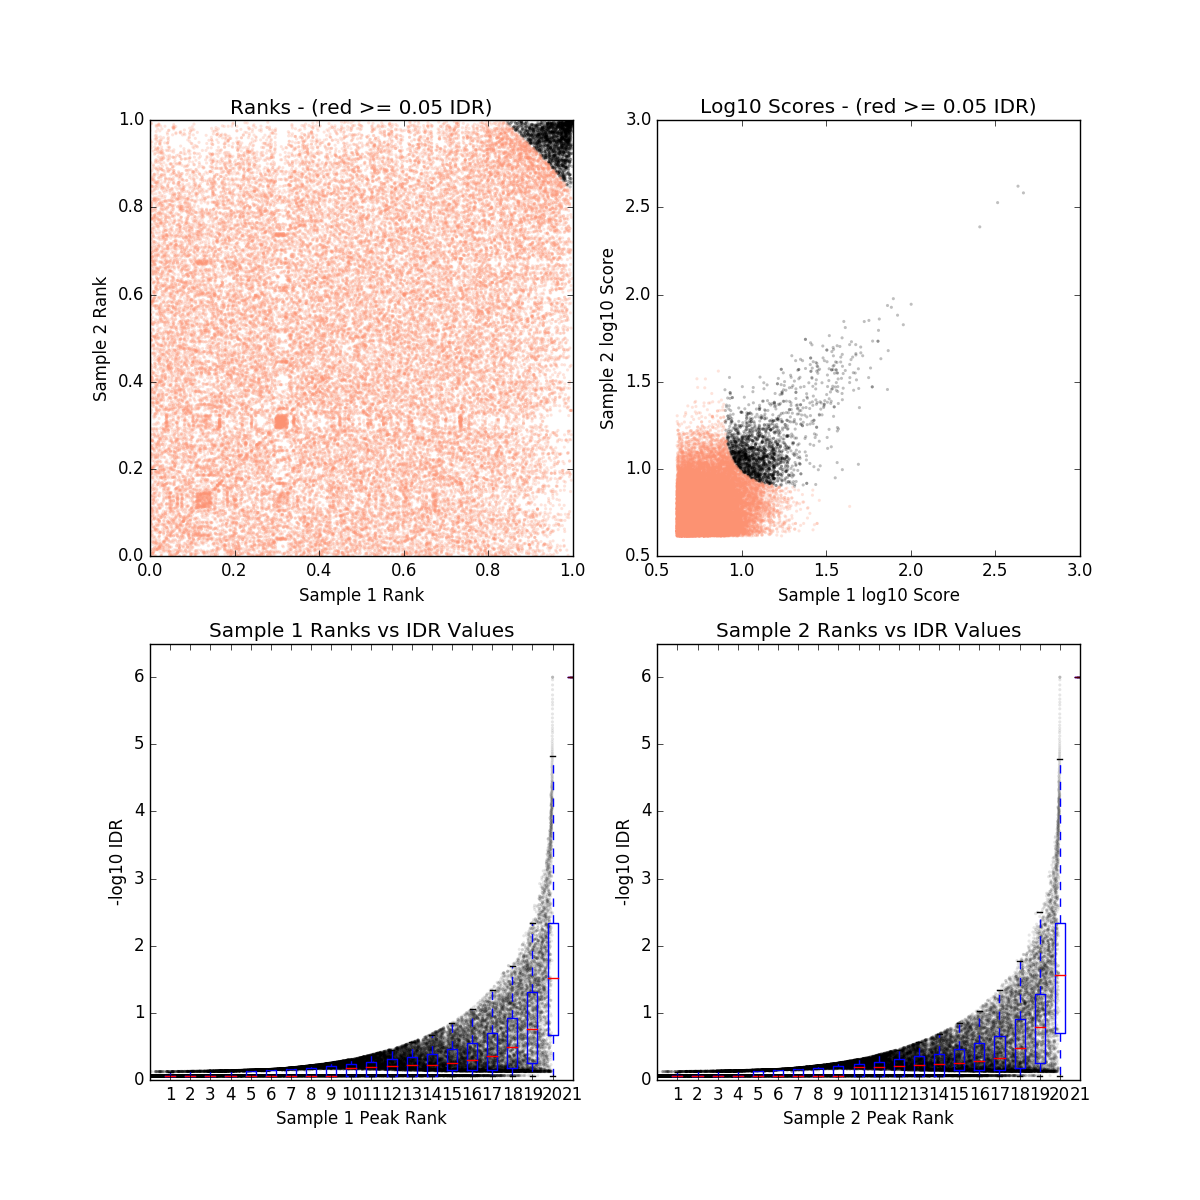
| IDR plot | ./peak/spp/idr/pseudo_reps/rep1/ery_CAPH2_mouse_rep1-pr.unthresholded-peaks.txt.png
|
| Replicate 2 | .
|
| FRiP | ./peak/spp/idr/pseudo_reps/rep2/ery_CAPH2_mouse_rep2-pr.IDR0.05.filt.narrowPeak.FRiP.qc
|
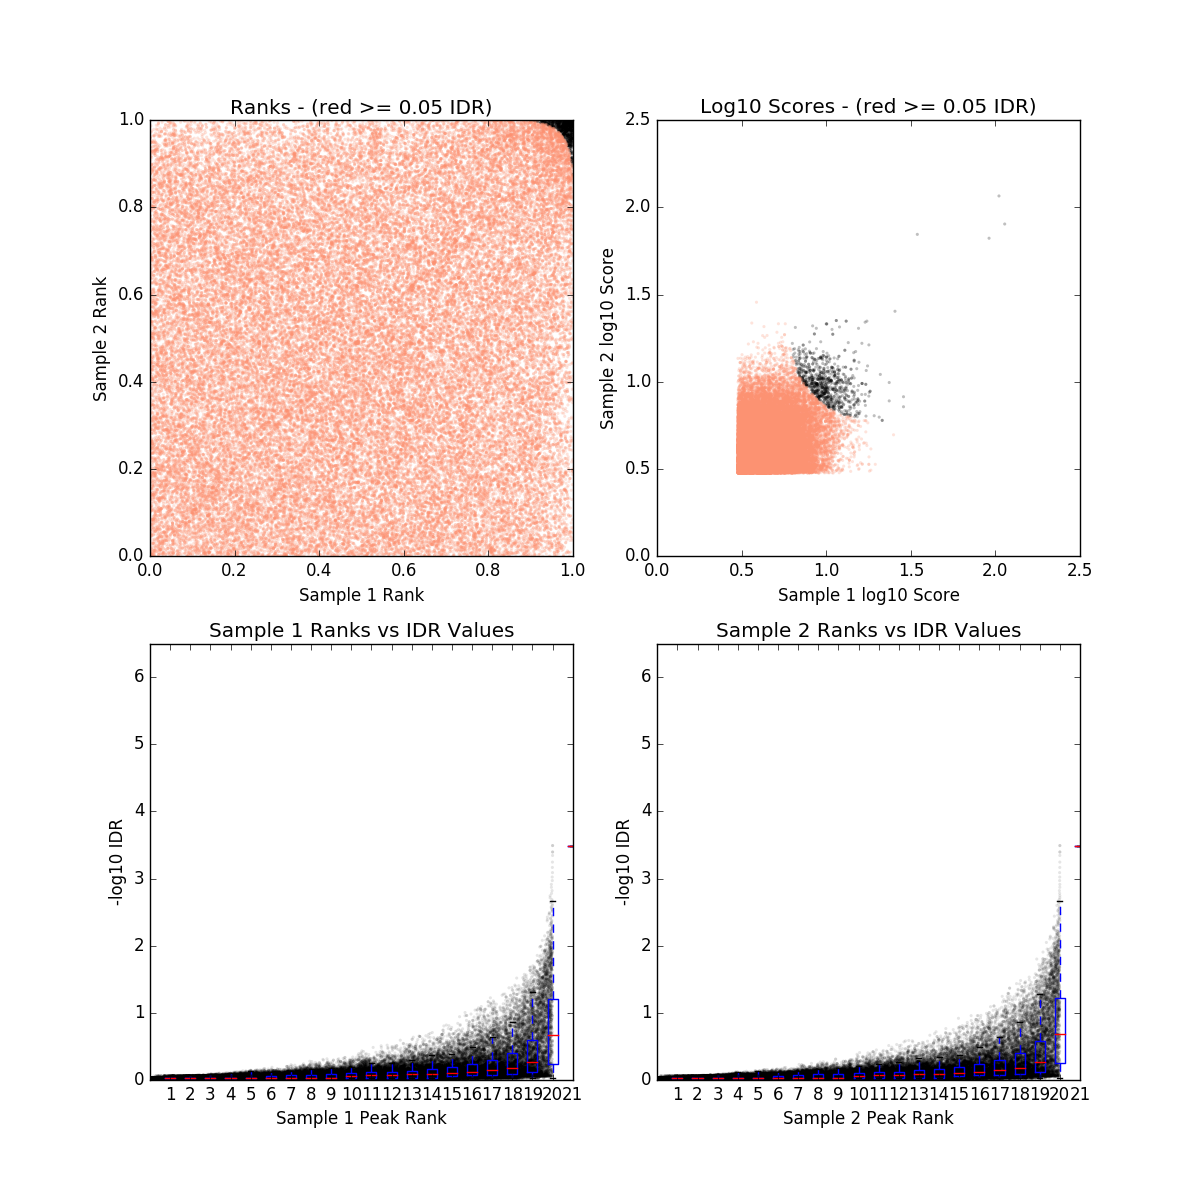
| IDR plot | ./peak/spp/idr/pseudo_reps/rep2/ery_CAPH2_mouse_rep2-pr.unthresholded-peaks.txt.png
|
| Pooled pseudo-replicates | .
|
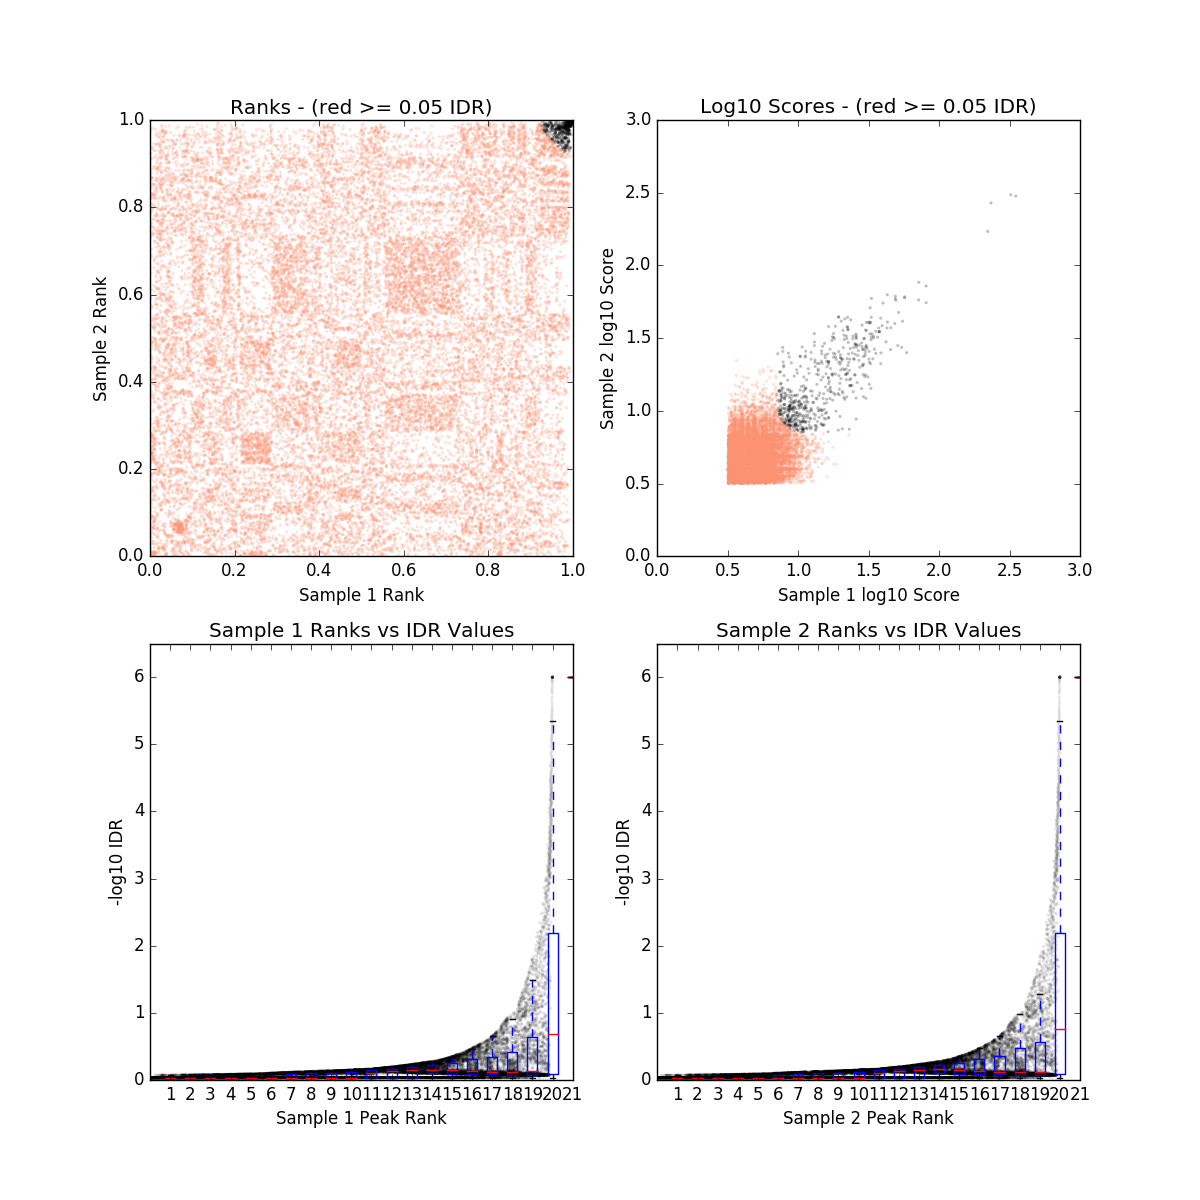
| IDR plot | ./peak/spp/idr/pooled_pseudo_reps/ery_CAPH2_mouse_ppr.unthresholded-peaks.txt.png
|